We can visually improve our plots by coloring them. This is generally done with the col graphical parameter.
We can specify the name of the color we want as a string. Let us look at an example.
We use the following temp vector to create a barplot throughout this section.
# create a vector 'temp' with numeric values
temp <- c(5, 7, 6, 4, 8)

# Plot 1: Bar plot with default settings
barplot(temp, main = "By default")

# Plot 2: Bar plot with custom coloring
barplot(temp, col = "coral", main = "With coloring")
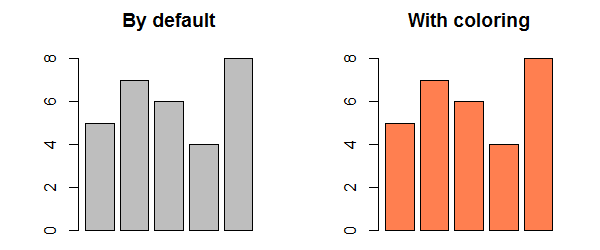
Here we use the color coral. Try replacing it with green, blue, violet etc. and look at the difference.
Using Color Names
R programming has names for 657 colors. You can take a look at them all with the colors() function, or simply check this R color pdf.
colors()
Output
[1] "white"                "aliceblue"            "antiquewhite"
[4] "antiquewhite1"        "antiquewhite2"        "antiquewhite3"
[7] "antiquewhite4"        "aquamarine"           "aquamarine1"
...
[655] "yellow3"              "yellow4"              "yellowgreen"
This returns a vector of all the color names in alphabetical order with the first element being white. You can color your plot by indexing this vector.
For example, col=colors()[655] is the same as col="yellow3".
Using Hex Values as Colors
Instead of using a color name, color can also be defined with a hexadecimal value.
We define a color as a 6 hexadecimal digit number of the form #RRGGBB. Where the RR is for red, GG for green and BB for blue and value ranges from 00 to FF.
For example, #FF0000 would be red and #00FF00 would be green similarly, #FFFFFF would be white and #000000 would be black.
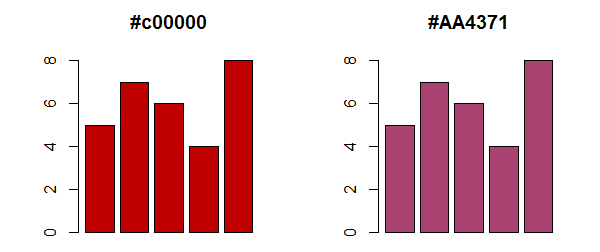
barplot(temp, col="#c00000", main="#c00000")
barplot(temp, col="#AA4371", main="#AA4371")
Using RGB Values
The function rgb() allows us to specify red, green and blue components with a number between 0 and 1.
This function returns the corresponding hex code discussed above.
# RGB representation: rgb(0, 1, 0)
result1 <- rgb(0, 1, 0)
print(result1)

# RGB representation: rgb(0.3, 0.7, 0.9)
result2 <- rgb(0.3, 0.7, 0.9)
print(result2)
Output
[1] "#00FF00"
[1] "#4DB3E6"
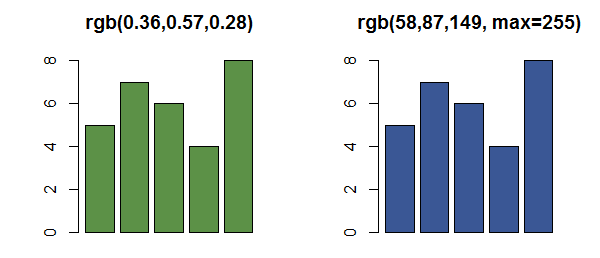
We can specify in the range 0 to 255 with the additional argument max=255.
# RGB representation: rgb(55, 0, 77, max = 255)
result <- rgb(55, 0, 77, max = 255)
print(result)
Output
[1] "#37004D"
Color Cycling in R
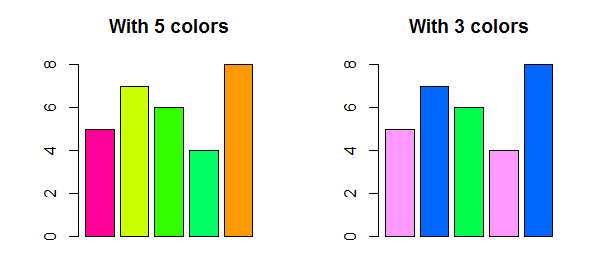
We can color each bar of the barplot with a different color by providing a vector of colors.
If the number of colors provided is less than the number of bars, the color vector is recycled.
We can see this in the following example.
# Plot 2: Bar plot with 3 custom colors
colors2 <- c("#FF99FF", "#0066FF", "#00FF4D")
barplot(temp, col = colors2, main = "With 3 colors")
Using Color Palette
R programming offers 5 built in color palettes which can be used to quickly generate color vectors of desired length.
They are: rainbow(), heat.colors(), terrain.colors(), topo.colors() and cm.colors(). We pass in the number of colors that we want.
# generate a sequence of colors using the rainbow() function
result <- rainbow(5)
print(result)
Output
[1] "#FF0000FF" "#CCFF00FF" "#00FF66FF" "#0066FFFF" "#CC00FFFF"
Notice above that the hexadecimal numbers are 8 digits long. The last two digits are the transparency level with FF being opaque and 00 being fully transparent.
barplot(temp, col=rainbow(5), main="rainbow")
barplot(temp, col=heat.colors(5), main="heat.colors")
barplot(temp, col=terrain.colors(5), main="terrain.colors")
barplot(temp, col=topo.colors(5), main="topo.colors")
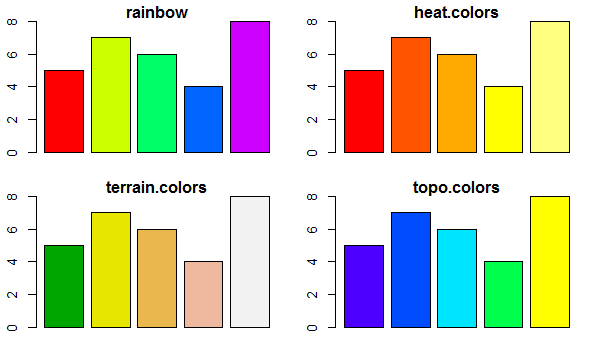
For more info, visit R Color Palettes
You can try out cm.colors() for yourself.